TRON Lightcycle / Run Wait Times: The Real Numbers
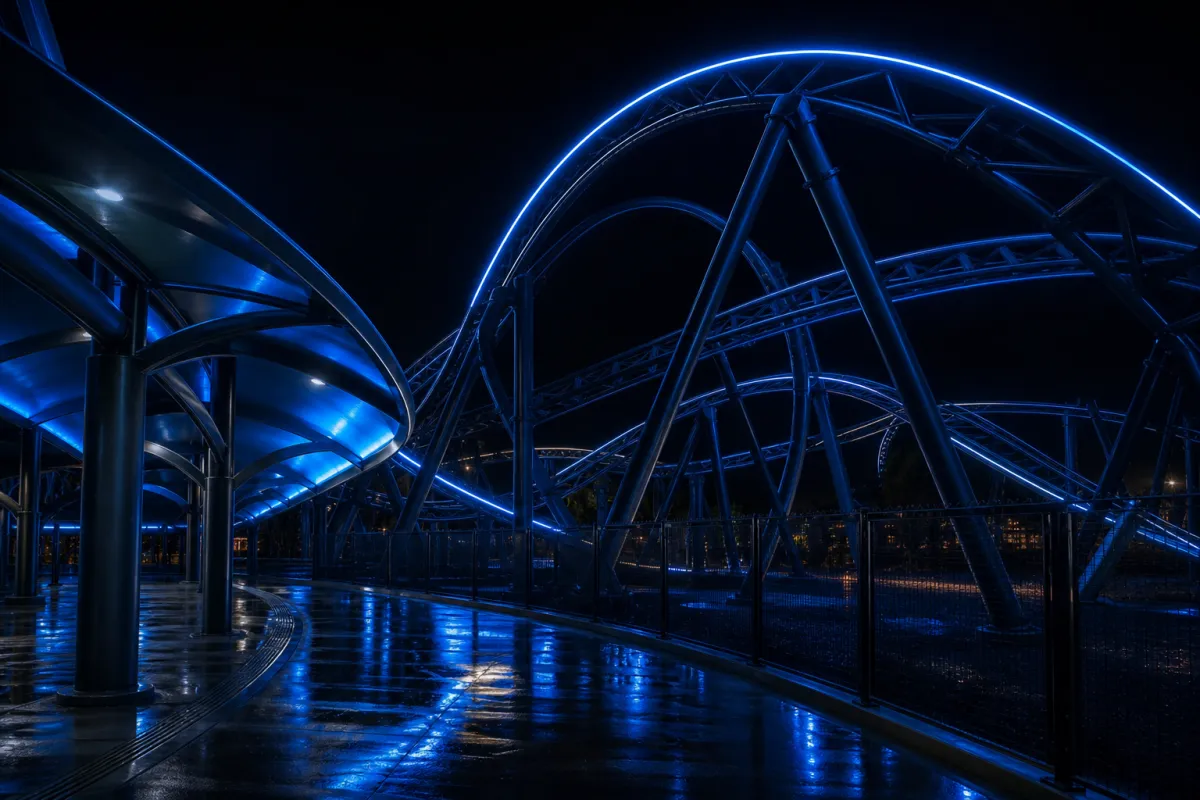
TRON Lightcycle / Run averages 54.4 minutes of wait, the longest average wait of any attraction at Magic Kingdom — more than 13 minutes ahead of the park's next-busiest ride.
Here is the full picture, hour by hour and ride by ride.
How TRON compares to the rest of Magic Kingdom
Across every attraction at Magic Kingdom, TRON sits alone at the top. The gap to second place is not small.
| Attraction | Zone | Avg wait (min) | Peak hourly avg (min) |
|---|---|---|---|
| TRON Lightcycle / Run | Tomorrowland | 54.4 | 97 |
| Seven Dwarfs Mine Train | Fantasyland | 41.1 | 66 |
| Peter Pan's Flight | Fantasyland | 33.6 | 53 |
| Space Mountain | Tomorrowland | 31.4 | 75 |
| Tiana's Bayou Adventure | Frontierland | 31.2 | 60 |
| Buzz Lightyear's Space Ranger Spin | Tomorrowland | 28.4 | 58 |
| Big Thunder Mountain Railroad | Frontierland | 27.4 | 61 |
Seven Dwarfs Mine Train is the closest competitor at 41.1 minutes, and even that trails TRON by nearly a quarter. Nothing else in the park comes close to TRON's peak hourly average of 97 minutes, the single highest hourly figure recorded on any attraction at Magic Kingdom.
The hour that decides your wait
TRON's own best and worst hours are not the same as the park's best and worst hours. Averaged across every attraction, Magic Kingdom's easiest hour is 8am at 11.3 minutes and its hardest is 7pm at 22.7 minutes. TRON runs on a different clock entirely.
| Metric | Hour | Avg wait (min) |
|---|---|---|
| TRON best hour | 8am | 34.6 |
| TRON worst hour | 8pm | 69.5 |
| TRON peak hourly avg (all-time high hour) | — | 97 |
Even at its best, TRON never dips below 34.6 minutes in our data. By 8pm, the typical wait has roughly doubled to 69.5 minutes. That means the "cheap" hour for most of Magic Kingdom, the early evening lull that helps rides like Pirates of the Caribbean or the Enchanted Tiki Room, does nothing for TRON. It gets worse as the night goes on, not better.
What this means for your ride order
If TRON is a priority, the data points to one clear window: as early as your ticket and park hours allow. A 34.6-minute average at 8am beats every other hour on record for this ride, and it is the only hour where TRON's wait drops meaningfully below its all-day average of 54.4 minutes.
Compare that to Space Mountain, which shares Tomorrowland with TRON. Space Mountain's own worst hour is 12pm at a 42-minute average, still 27 minutes shorter than TRON's worst hour. If your morning plan cannot fit both headliners, the numbers suggest TRON deserves the earlier slot and Space Mountain can absorb a midday visit with less damage to your day.
For a full breakdown of Magic Kingdom's best and worst hours across every ride, see Magic Kingdom wait time patterns by hour and Best times to ride Magic Kingdom. If you are building a full-day plan around TRON and its Tomorrowland neighbors, our Magic Kingdom touring plan guide walks through ride order in detail, and avoiding crowds at Magic Kingdom covers broader timing strategy. For Lightning Lane context on TRON specifically, see Disney World Lightning Lane.
You can also check live and typical wait patterns directly at parkautopilot.com/wait-times/magic-kingdom.
Ready to put this into practice? Park Autopilot creates your touring plan from real-time wait times. Try it free →
Ready to put this into practice?
Park Autopilot takes everything in this guide and automates it. Just open the app on your park day, and it'll tell you exactly where to go next based on current wait times.
Try Park Autopilot NowRelated Articles
9 Rides Whose Worst Hour Is Dinnertime, Not Lunch
Magic Kingdom's worst hour is 6pm, not noon. Nine Orlando attractions peak after 4pm, and the standard avoid-midday advice walks you straight into them.

8 Quiet Disney World Rides Whose Wait More Than Triples
Wildlife Express Train averages 7.4 minutes and reaches 42 at its busiest hour. The gentlest rides at Disney World have the ugliest bad days. Here are eight.

10 Disney World Rides That Are Walk-Ons Until They Aren't
The Wildlife Express Train averages 7.4 minutes; its busiest hour hits 42. Ten Disney World rides swing from walk-on to a real line, and eight break at once.