The Four Disney Parks, Ranked by Wait Time
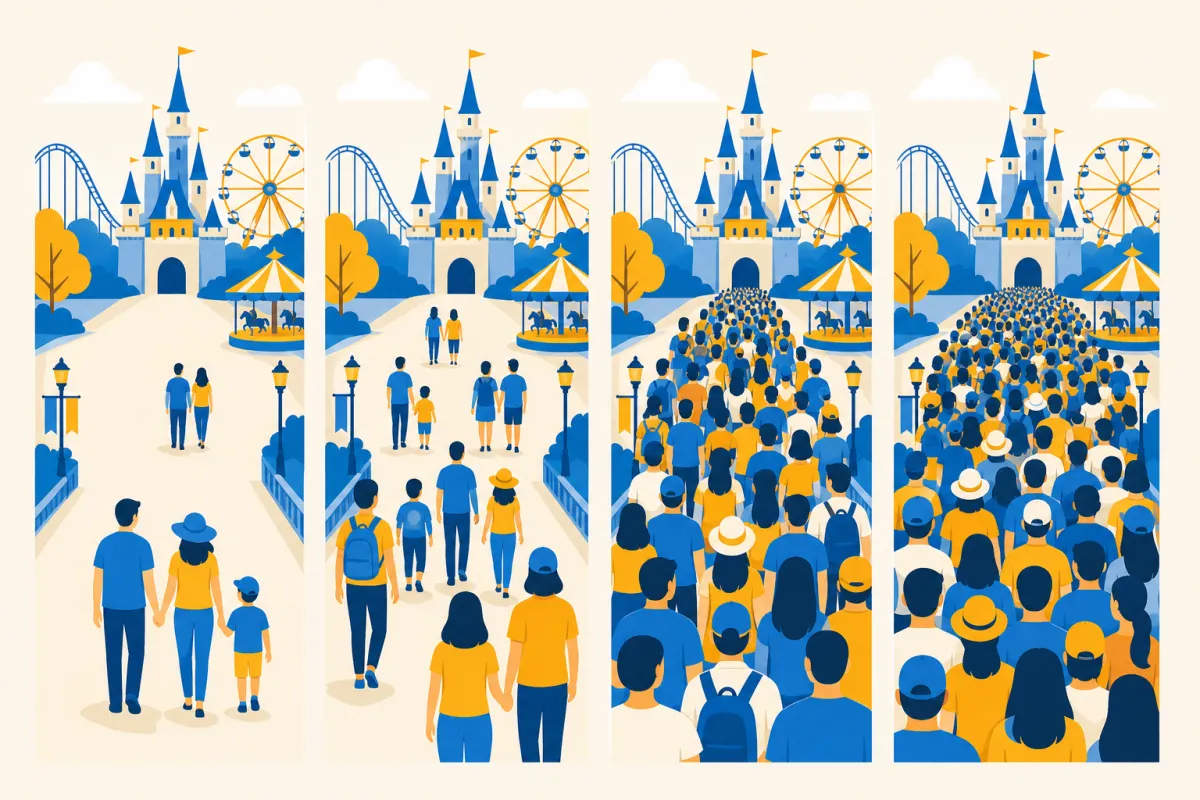
Hollywood Studios runs the longest average wait of the four Walt Disney World parks in our data. Magic Kingdom — the busiest of the four by attendance — is actually the calmest.
The hour-by-hour picture, side by side
Here is the park-wide average wait, hour by hour, for every Walt Disney World park in our data:
| Hour | Magic Kingdom | EPCOT | Hollywood Studios | Animal Kingdom |
|---|---|---|---|---|
| 8am | 11.3 | 26.5 | 20.5 | 19.2 |
| 9am | 14.6 | 24.7 | 26.1 | 21.9 |
| 10am | 17.4 | 26.2 | 35.2 | 27.4 |
| 11am | 20.4 | 30.3 | 38.4 | 30 |
| 12pm | 22.1 | 29.8 | 40 | 30.9 |
| 1pm | 21.5 | 28.4 | 37.1 | 27.9 |
| 2pm | 19.2 | 26.8 | 36.5 | 24.9 |
| 3pm | 20.5 | 26.6 | 33.5 | 22.8 |
| 4pm | 20.6 | 26.8 | 31.7 | 21.9 |
| 5pm | 21.4 | 26.7 | 33.6 | 22 |
| 6pm | 21.8 | 27.3 | 35.4 | 19.3 |
| 7pm | 22.7 | 28.5 | 39.1 | 13.5 |
| 8pm | 21.6 | 26.2 | 36.5 | 17.5 |
| 9pm | 17.7 | 24 | 25.6 | — |
| 10pm | 13.2 | 19.5 | 22.5 | — |
Animal Kingdom's data runs 8am–8pm; the other three run 8am–10pm. Averaging each park's own hourly figures above gives a simple, comparable ranking:
| Park | Avg of hourly waits (min) | Best hour | Worst hour | Swing |
|---|---|---|---|---|
| Hollywood Studios | 32.8 | 8am — 20.5 | 12pm — 40 | 95% |
| EPCOT | 26.6 | 10pm — 19.5 | 11am — 30.3 | 55% |
| Animal Kingdom | 23.0 | 7pm — 13.5 | 12pm — 30.9 | 129% |
| Magic Kingdom | 19.1 | 8am — 11.3 | 7pm — 22.7 | 101% |
By this measure, the order from busiest to calmest is Hollywood Studios, EPCOT, Animal Kingdom, then Magic Kingdom. Animal Kingdom has the widest swing of any park — its worst hour runs more than double its best — but because its best hour (7pm) is so low, its overall average still lands well below Hollywood Studios and EPCOT.
The single longest wait doesn't belong to the busiest park
Ranking by daily average is one lens. Ranking by headliner is another, and it tells a different story:
| Park | Longest average wait | Attraction |
|---|---|---|
| EPCOT | 69.5 min | Guardians of the Galaxy: Cosmic Rewind |
| Hollywood Studios | 56 min | Slinky Dog Dash |
| Magic Kingdom | 54.4 min | TRON Lightcycle / Run |
| Animal Kingdom | 49.8 min | Avatar Flight of Passage |
Hollywood Studios has the busiest park overall, but EPCOT holds the single longest average wait of any attraction across the four parks: Guardians of the Galaxy: Cosmic Rewind at 69.5 minutes. A park can run calmer on average and still hide the longest individual line.
Best and worst day, park by park
| Park | Quietest day | Busiest day |
|---|---|---|
| Magic Kingdom | Tuesday — 15.3 min | Wednesday — 22.4 min |
| EPCOT | Thursday — 25.1 min | Tuesday — 29.7 min |
| Hollywood Studios | Wednesday — 28.5 min | Friday — 38.6 min |
| Animal Kingdom | Wednesday — 19.6 min | Saturday — 26.7 min |
There's no single "best day" that works across all four parks. Wednesday is the quietest day at Hollywood Studios and Animal Kingdom — but it's Magic Kingdom's busiest day of the week. If your trip covers multiple parks, the smart move is matching each park to its own quiet day rather than picking one day and hitting all of them.
The takeaway
Ranked by overall wait in our data, from busiest to calmest: Hollywood Studios, EPCOT, Animal Kingdom, Magic Kingdom. But "calmest park" and "shortest single line" aren't the same thing — EPCOT's Guardians of the Galaxy: Cosmic Rewind outwaits every other headliner at Walt Disney World, busiest park or not. Plan around the specific ride you want, not just the park's reputation.
For live numbers on your visit day, check the wait times pages for Magic Kingdom, EPCOT, Hollywood Studios, and Animal Kingdom.
Related reading
- Magic Kingdom Touring Plan
- EPCOT Touring Plan
- EPCOT vs. Hollywood Studios Waits
- The Best Hour at Every Orlando Park
- Your First Hour at a Disney Park, Planned
Ready to put this into practice? Park Autopilot creates your touring plan from real-time wait times. Try it free →
Ready to put this into practice?
Park Autopilot takes everything in this guide and automates it. Just open the app on your park day, and it'll tell you exactly where to go next based on current wait times.
Try Park Autopilot NowRelated Articles
9 Rides Whose Worst Hour Is Dinnertime, Not Lunch
Magic Kingdom's worst hour is 6pm, not noon. Nine Orlando attractions peak after 4pm, and the standard avoid-midday advice walks you straight into them.

8 Quiet Disney World Rides Whose Wait More Than Triples
Wildlife Express Train averages 7.4 minutes and reaches 42 at its busiest hour. The gentlest rides at Disney World have the ugliest bad days. Here are eight.

10 Disney World Rides That Are Walk-Ons Until They Aren't
The Wildlife Express Train averages 7.4 minutes; its busiest hour hits 42. Ten Disney World rides swing from walk-on to a real line, and eight break at once.