Universal Studios Florida Wait Times by Hour
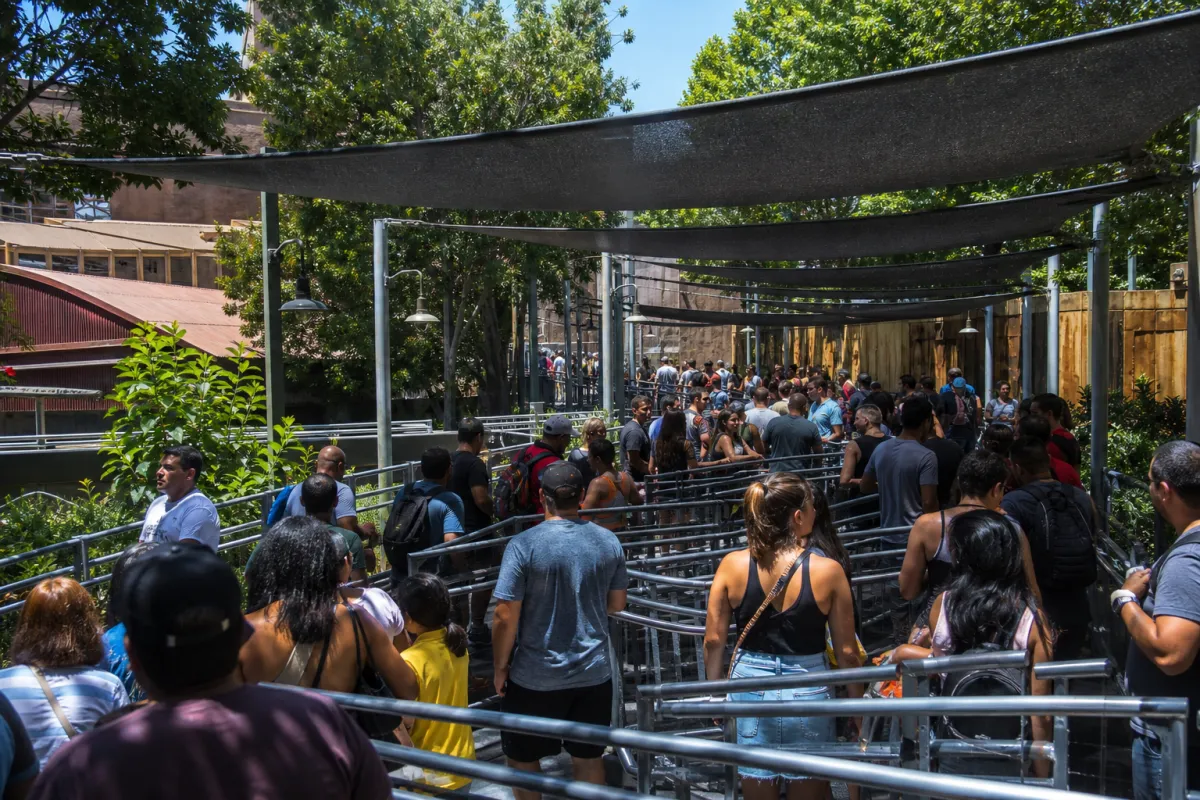
Despicable Me Minion Mayhem's typical wait multiplies more than tenfold over the course of a day: 4.6 minutes at 10pm versus 47.5 minutes at 11am. That is the largest hour-to-hour swing of any attraction we tracked at Universal Studios Florida — bigger, proportionally, than even Escape from Gringotts.
The park-wide pattern
| Hour | Avg wait across all attractions (min) |
|---|---|
| 10am | 13.9 |
| 11am | 18.3 |
| 12pm | 22.6 |
| 1pm | 23.0 |
| 2pm | 23.7 |
| 3pm | 24.8 |
| 4pm | 24.3 |
| 5pm | 22.8 |
| 6pm | 20.8 |
| 7pm | 17.8 |
| 8pm | 16.4 |
| 9pm | 14.6 |
| 10pm | 11.5 |
The park-wide average moves from 13.9 minutes at 10am to a peak of 24.8 minutes at 3pm — a 116% increase — before falling back to 11.5 minutes by 10pm. That is the shape of the day. But the ride-level data shows the real story is more extreme than the park-wide average suggests.
Every ride's best hour and worst hour
| Attraction | Best hour | Best avg | Worst hour | Worst avg | Worst ÷ Best |
|---|---|---|---|---|---|
| Despicable Me Minion Mayhem | 10pm | 4.6 | 11am | 47.5 | 10.3x |
| TRANSFORMERS: The Ride-3D | 10pm | 6.9 | 12pm | 36.3 | 5.3x |
| Race Through New York Starring Jimmy Fallon | 10pm | 6.9 | 12pm | 30.5 | 4.4x |
| Trolls Trollercoaster | 10pm | 4.6 | 3pm | 17.1 | 3.7x |
| Hogwarts Express – King's Cross Station | 10am | 9.9 | 5pm | 36.2 | 3.7x |
| The Simpsons Ride | 10am | 11.9 | 2pm | 37.4 | 3.1x |
| Fast & Furious – Supercharged | 10am | 10.0 | 5pm | 30.3 | 3.0x |
| Harry Potter and the Escape from Gringotts | 10pm | 16.1 | 3pm | 49.5 | 3.1x |
| MEN IN BLACK Alien Attack! | 10am | 9.9 | 2pm | 27.5 | 2.8x |
| Kang & Kodos' Twirl 'n' Hurl | 11am | 5.1 | 2pm | 12.9 | 2.5x |
| Revenge of the Mummy | 10am | 14.5 | 1pm | 31.0 | 2.1x |
| Villain-Con Minion Blast | 10pm | 4.6 | 11am | 9.1 | 2.0x |
| E.T. Adventure | 11am | 20.1 | 12pm | 33.1 | 1.6x |
Despicable Me Minion Mayhem stands alone at the top of this list. Its 10.3x swing means the exact same ride can feel like a walk-on at 10pm and a 47-minute commitment at 11am — a difference most guests never see coming, because the ride doesn't have the "headliner" reputation that would make them plan around it the way they plan around Gringotts.
Gringotts' wait time, in context
Escape from Gringotts still posts the highest single-hour average in our data: 49.5 minutes at 3pm. Its swing (3.1x, from 16.1 minutes at 10pm) is large in absolute terms but proportionally smaller than several other rides on this list. In practice, that means Gringotts is consistently in demand throughout the day — there's no true "secret good hour" the way there is for Despicable Me Minion Mayhem. Your best bet is still riding it at park open or after 9pm.
Worst hours cluster around midday
Look at the "worst hour" column: five of the thirteen tracked rides post their single worst average between 11am and 12pm, and three more peak at 2pm. Very few rides are at their worst in the evening. That clustering is the clearest actionable signal in our wait-time data — the 11am–2pm window is when USF crowds compound across nearly every land at once, not just at the headliners.
What this means for your day
If you are choosing when to ride a specific attraction rather than following a fixed touring order, this data suggests two rules:
- Treat Despicable Me Minion Mayhem like a headliner, not a filler ride. Its worst-hour wait (47.5 minutes) is higher than Revenge of the Mummy's worst hour (31 minutes), despite Mummy having the bigger reputation.
- Avoid stacking any midday ride between 11am and 2pm. This is when the largest share of attractions we track hit their individual peaks — not just the park-wide average.
For a full ride-by-ride plan built on this same data, see our Universal Studios Florida touring plan. For how these swings compare to other Orlando parks, see the best hour at every Orlando park and rides with the biggest hourly swings.
See the live version of this data at parkautopilot.com/wait-times/universal-studios-orlando.
Ready to put this into practice? Park Autopilot creates your touring plan from real-time wait times. Try it free →
Ready to put this into practice?
Park Autopilot takes everything in this guide and automates it. Just open the app on your park day, and it'll tell you exactly where to go next based on current wait times.
Try Park Autopilot NowRelated Articles
9 Rides Whose Worst Hour Is Dinnertime, Not Lunch
Magic Kingdom's worst hour is 6pm, not noon. Nine Orlando attractions peak after 4pm, and the standard avoid-midday advice walks you straight into them.

8 Quiet Disney World Rides Whose Wait More Than Triples
Wildlife Express Train averages 7.4 minutes and reaches 42 at its busiest hour. The gentlest rides at Disney World have the ugliest bad days. Here are eight.

10 Disney World Rides That Are Walk-Ons Until They Aren't
The Wildlife Express Train averages 7.4 minutes; its busiest hour hits 42. Ten Disney World rides swing from walk-on to a real line, and eight break at once.