Which Orlando Park Actually Has the Shortest Lines?
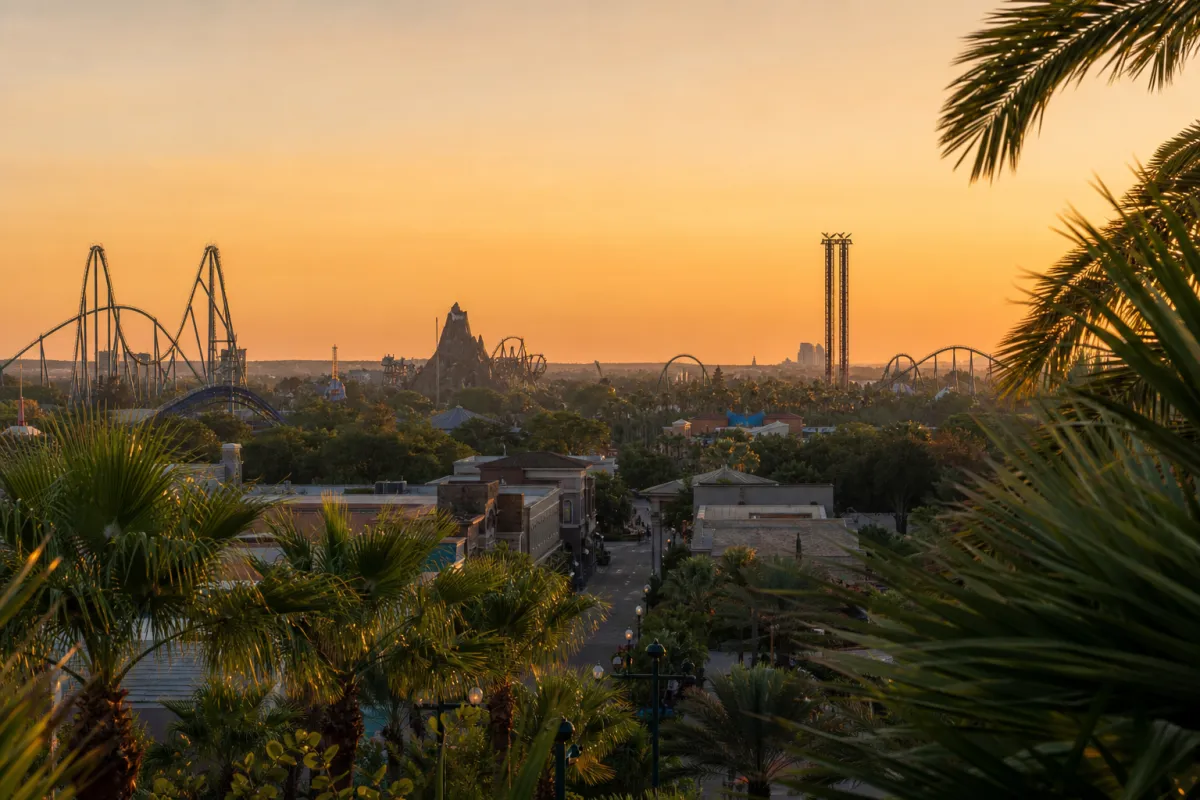
Among Disney's four Walt Disney World parks, Magic Kingdom posts the shortest average wait at 19.1 minutes per attraction — but even that trails SeaWorld Orlando's 14.8-minute average, the shortest of the eight major Orlando parks in this comparison. Epic Universe averages 33.3 minutes, more than double that, and its Mine-Cart Madness ride alone posts an 81.1-minute average, the longest of any attraction we track.
That's the headline. Here's the full ranking, park by park, with the receipts.
How we calculated this
Neither Disney nor Universal publishes a single "park average wait" number. What we do have, for each park, is an hour-by-hour average wait across the attractions we track. To rank the parks, we averaged each park's own hourly figures into one park-wide number. It's arithmetic on real, cited data — not a new estimate — and we show our work below so you can check it against each park's hour-by-hour table.
One caveat: Universal Studios Florida's figures only run dense from 10am on, and Animal Kingdom's stop at 8pm. Both are noted in the table.
The ranking
| Rank | Park | Park-wide avg wait (min) | Hours averaged | Best hour | Worst hour |
|---|---|---|---|---|---|
| 1 | SeaWorld Orlando | 14.8 | 8am–10pm | 8am (4.6 min) | 4pm (22.6 min) |
| 2 | Islands of Adventure | 18.7 | 8am–10pm | 9am (14 min) | 12pm (24.1 min) |
| 3 | Magic Kingdom | 19.1 | 8am–10pm | 8am (11.3 min) | 7pm (22.7 min) |
| 4 | Universal Studios Florida | 19.6 | 10am–10pm | 10pm (11.5 min) | 3pm (24.8 min) |
| 5 | Animal Kingdom | 23.0 | 8am–8pm | 7pm (13.5 min) | 12pm (30.9 min) |
| 6 | EPCOT | 26.6 | 8am–10pm | 10pm (19.5 min) | 11am (30.3 min) |
| 7 | Hollywood Studios | 32.8 | 8am–10pm | 8am (20.5 min) | 12pm (40 min) |
| 8 | Epic Universe | 33.3 | 8am–10pm | 9pm (21.8 min) | 12pm (45.8 min) |
Two parks separate cleanly from the pack at the bottom: Hollywood Studios and Epic Universe both average north of 30 minutes per ride, driven by a small number of headliners that post genuinely long waits (Slinky Dog Dash at 56 minutes average, Rock 'n' Roller Coaster Starring The Muppets at 47.5, Mine-Cart Madness at 81.1, Harry Potter and the Battle at the Ministry at 61.8).
Disney's four parks, ranked
Among the four Disney parks in our data, the spread is wide: Magic Kingdom (19.1 min average) is roughly the same tier as the Universal parks, while Hollywood Studios (32.8 min) runs nearly 72% higher. EPCOT (26.6 min) and Animal Kingdom (23.0 min) sit in between.
Magic Kingdom's advantage comes from attraction count and variety — it has far more attractions than any other park in this comparison, many of them high-capacity dark rides and shows (it's a small world at 9.6 min average, Pirates of the Caribbean at 12.2) that pull the park-wide figure down even with TRON Lightcycle / Run running a 54.4-minute average. Hollywood Studios, by contrast, has far fewer attractions and most of them are E-ticket headliners — there's less low-wait inventory to balance out Slinky Dog Dash and Star Wars: Rise of the Resistance (45.1 min average).
Universal's two Orlando parks compared
Islands of Adventure (18.7 min) runs meaningfully lower than Epic Universe (33.3 min) — the newer park's average is almost 80% higher. That tracks with what's driving the numbers at each: IOA's biggest outlier is Hagrid's Magical Creatures Motorbike Adventure at 60.3 minutes average, but its other 16 attractions include a long tail of sub-10-minute rides in Seuss Landing and Marvel Super Hero Island. Epic Universe has fewer low-wait options relative to its size — Super Nintendo World's Mine-Cart Madness (81.1 min) and Ministry of Magic's Harry Potter and the Battle at the Ministry (61.8 min) both post waits longer than anything at Islands of Adventure, and even the park's shortest-average attraction, Bowser Jr. Challenge, still runs 7.7 minutes.
Universal Studios Florida (19.6 min) sits almost exactly between the two — closer to Islands of Adventure than to Epic Universe.
SeaWorld Orlando: the outlier
SeaWorld's 14.8-minute average isn't close. Its worst single hour (4pm, 22.6 min) is still lower than six of the other seven parks' best hours. But the relative swing inside SeaWorld's day is the most dramatic in our wait-time data: the park's worst hour runs 391% above its best hour (4.6 min at 8am to 22.6 min at 4pm) — by far the largest best-to-worst spread of any Orlando park. Arrive at rope drop here and you'll see genuinely empty queues; show up mid-afternoon and the picture changes fast.
Day of week: when "shortest lines" flips
Averages hide day-to-day movement. Two things stand out in the day-of-week tables:
| Park | Quietest day | Busiest day |
|---|---|---|
| Magic Kingdom | Tuesday (15.3 min) | Wednesday (22.4 min) |
| EPCOT | Thursday (25.1 min) | Tuesday (29.7 min) |
| Hollywood Studios | Wednesday (28.5 min) | Friday (38.6 min) |
| Animal Kingdom | Wednesday (19.6 min) | Saturday (26.7 min) |
| SeaWorld Orlando | Tuesday (10.3 min) | Sunday (23.6 min) |
| Islands of Adventure | Thursday (16.6 min) | Saturday (22.9 min) |
| Universal Studios Florida | Thursday (18.9 min) | Saturday (22.2 min) |
| Epic Universe | Wednesday (28.9 min) | Monday (39.9 min) |
Notice EPCOT is the one park where Tuesday is the busiest day rather than the quietest — the opposite pattern of Magic Kingdom and SeaWorld, both of which post their lowest average on Tuesday. If you're splitting a multi-park trip across a week, that's a reason to route EPCOT away from Tuesday and toward Magic Kingdom or SeaWorld instead.
The 10 longest average waits across all eight parks
Park-wide averages hide the individual rides doing the damage. Here's every attraction we track with an average wait above 46 minutes:
| Rank | Attraction | Park | Avg wait (min) |
|---|---|---|---|
| 1 | Mine-Cart Madness | Epic Universe | 81.1 |
| 2 | Guardians of the Galaxy: Cosmic Rewind | EPCOT | 69.5 |
| 3 | Test Track | EPCOT | 64.5 |
| 4 | Harry Potter and the Battle at the Ministry | Epic Universe | 61.8 |
| 5 | Hagrid's Magical Creatures Motorbike Adventure | Islands of Adventure | 60.3 |
| 6 | Slinky Dog Dash | Hollywood Studios | 56.0 |
| 7 | TRON Lightcycle / Run | Magic Kingdom | 54.4 |
| 8 | Avatar Flight of Passage | Animal Kingdom | 49.8 |
| 9 | Rock 'n' Roller Coaster Starring The Muppets | Hollywood Studios | 47.5 |
| 10 | Mario Kart: Bowser's Challenge | Epic Universe | 46.7 |
Epic Universe places three of its own attractions in this top 10 despite being the newest park in this comparison; EPCOT and Hollywood Studios place two apiece. Two parks are entirely absent from this list — SeaWorld Orlando and Universal Studios Florida — which lines up with where they land in the park-wide ranking above: neither park has a single outlier severe enough to drag its average up the way Mine-Cart Madness or Guardians of the Galaxy: Cosmic Rewind does for their parks.
The 10 shortest average waits across all eight parks
The other end of the list looks completely different — these are walk-on-or-close-to-it attractions in our wait-time data:
| Rank | Attraction | Park | Avg wait (min) |
|---|---|---|---|
| 1 | Gorilla Falls Exploration Trail | Animal Kingdom | 5.0 |
| 2 | Storm Force Accelatron | Islands of Adventure | 5.2 |
| 3 | Slimey's Slider | SeaWorld Orlando | 5.8 |
| 4 | Villain-Con Minion Blast | Universal Studios Florida | 5.9 |
| 5 | Cookie Drop | SeaWorld Orlando | 6.0 |
| 6 | Caro-Seuss-el | Islands of Adventure | 6.1 |
| 7 | Wildlife Express Train | Animal Kingdom | 6.3 |
| 8 | Prince Charming Regal Carrousel | Magic Kingdom | 6.4 |
| 9 | Star Tours – The Adventures Continue | Hollywood Studios | 6.6 |
| 10 | Mad Tea Party | Magic Kingdom | 6.7 |
Animal Kingdom is the split personality of our wait-time data: it holds both the single shortest average wait we track anywhere (Gorilla Falls Exploration Trail, a walk-through trail, at 5.0 minutes) and the third-longest (Avatar Flight of Passage, at 49.8 minutes) — the widest internal spread of any park in this comparison. Hollywood Studios shows the opposite problem: Star Tours is its only entry in either extreme list, and the park's other attractions all sit in double digits, which is a big part of why Hollywood Studios' park-wide average runs so high.
The one ride to fast-track at each park
Every park we track has exactly one attraction that runs well above the rest of its own lineup:
| Park | Longest-wait attraction | Avg wait (min) |
|---|---|---|
| Magic Kingdom | TRON Lightcycle / Run | 54.4 |
| EPCOT | Guardians of the Galaxy: Cosmic Rewind | 69.5 |
| Hollywood Studios | Slinky Dog Dash | 56.0 |
| Animal Kingdom | Avatar Flight of Passage | 49.8 |
| SeaWorld Orlando | Expedition Odyssey | 30.0 |
| Islands of Adventure | Hagrid's Magical Creatures Motorbike Adventure | 60.3 |
| Universal Studios Florida | Harry Potter and the Escape from Gringotts | 31.1 |
| Epic Universe | Mine-Cart Madness | 81.1 |
If you only have a single Lightning Lane, Universal Express, or early-entry ride to spend per park, this is the list to spend it on. In every case, the gap between that ride and the rest of its park's lineup is wide enough that fast-tracking anything else first would be the wrong call.
FAQ: Orlando wait times, answered with data
Which single attraction has the longest average wait in Orlando?
Mine-Cart Madness at Epic Universe, 81.1 minutes average — it also posts the highest peak hourly average we track, 134 minutes.
Which park has the widest swing between its best and worst hour?
SeaWorld Orlando, at 391% (4.6 minutes at 8am to 22.6 minutes at 4pm) — the largest best-to-worst gap of any park in this comparison.
Is there a day that's bad at every park?
Saturday is the busiest day at three of the eight parks (Islands of Adventure, Universal Studios Florida, and Animal Kingdom) and a near-busiest day at several more. It's the closest thing to a universal answer here.
Which park has an unusually bad Tuesday?
EPCOT. It's the only park in this comparison where Tuesday is the busiest day (29.7 minutes) rather than one of the calmer ones — Magic Kingdom and SeaWorld Orlando both post their lowest average of the week on Tuesday.
What this means for a multi-park trip
If shortest lines are your priority and you have flexibility: SeaWorld Orlando and Islands of Adventure are your lowest-average options in our wait-time data. If you're set on Hollywood Studios or Epic Universe, lean hard on arriving at open — both parks' best hour (8am and 9pm respectively) sits at roughly half their worst-hour average, so timing matters more there than anywhere else on this list.
For hour-by-hour planning inside a specific park, start with the live pages: Magic Kingdom wait times, Islands of Adventure wait times, or Universal Studios Florida wait times. For more on the biggest single-hour swings we found, see Never Ride These at Noon and The Single Worst Hour to Be Standing in a Theme Park. If you're comparing Disney and Universal head-to-head for a two-park day, Disney vs Universal Lines in 2026 and Two-Park Days in Orlando go deeper on logistics.
Ready to put this into practice? Park Autopilot creates your touring plan from real-time wait times. Try it free →
Ready to put this into practice?
Park Autopilot takes everything in this guide and automates it. Just open the app on your park day, and it'll tell you exactly where to go next based on current wait times.
Try Park Autopilot NowRelated Articles
9 Rides Whose Worst Hour Is Dinnertime, Not Lunch
Magic Kingdom's worst hour is 6pm, not noon. Nine Orlando attractions peak after 4pm, and the standard avoid-midday advice walks you straight into them.
8 Quiet Disney World Rides Whose Wait More Than Triples
Wildlife Express Train averages 7.4 minutes and reaches 42 at its busiest hour. The gentlest rides at Disney World have the ugliest bad days. Here are eight.

10 Disney World Rides That Are Walk-Ons Until They Aren't
The Wildlife Express Train averages 7.4 minutes; its busiest hour hits 42. Ten Disney World rides swing from walk-on to a real line, and eight break at once.